Transcript:
Carbon Pricing Basics
The Climate Challenge
This is about the Climate challenge. It’s about the, the need to reduce carbon emissions, and it’s about the need for collective action to reduce carbon emissions. Carbon emissions result in externalities, so that is a market failure. To address this market failure and to reduce carbon emissions, there is a role of public policy.
How did it all start?
Before going into the specific concepts and the theory, just a few words on how this started. It started back in the, primarily in the United States with theoretical articulation of instruments, and it also started with some thinking at the US Environmental Protection Agency.
So early on they started to think about the social costs of global warming of pollutions generally, and then how to address externalities. And this led to developments in the US eventually resulting in the first cap and trade or emissions trading program as part of the US a acid rain program as part of the Clean Air Act.
So that was the first type, or the first prototype of emissions trading. And of course, we’ll come back to explaining exactly what emissions trading is. From that, there were discussions going into the UNFCCC, the climate convention. It led to the adoption by the European Union of a quite large emission trading scheme.
Discussions also led to carbon taxes being introduced in the early nineties, starting with countries like Sweden and Finland. And on a side note, the first offset project started in 1988, when an energy firm in the US got the advice to plant trees in Guatemala to offset its emissions. We’ll come back to that as well.
History of Carbon Markets
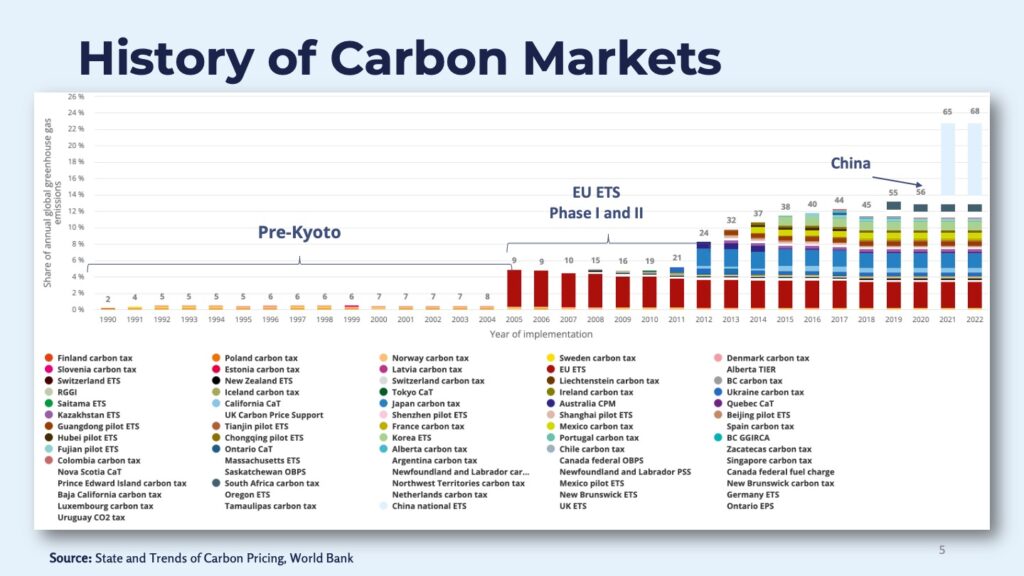
So before going into the concepts just to show the immense growth of carbon markets of emissions trading and carbon taxes, through the years.
You cannot read the details of this, but you can see that before the Kyoto protocol, this was quite limited in scale. There was, as I said, carbon taxes in a few European countries. The European Union started to look at emissions trading and with the implementation of the EU ETS starting 2005 with a pilot and then taking off seriously.
So as it were in 2008, you see that the amount of emissions covered by emissions trading grew significantly. And from that, a lot of emission trading schemes have been, added. And the last large things you can see here is the adoption of the National Emissions Trading Scheme in China.
So there’s been quite a substantial growth in emissions trading scheme and in carbon pricing from the early nineties up to up until today. And this covers taxes, pure emissions trading schemes, but also hybrid schemes like South Africa, Columbia, allowing the use of offsets from the carbon market to comply with the carbon tax.
Global Carbon Market Landscape
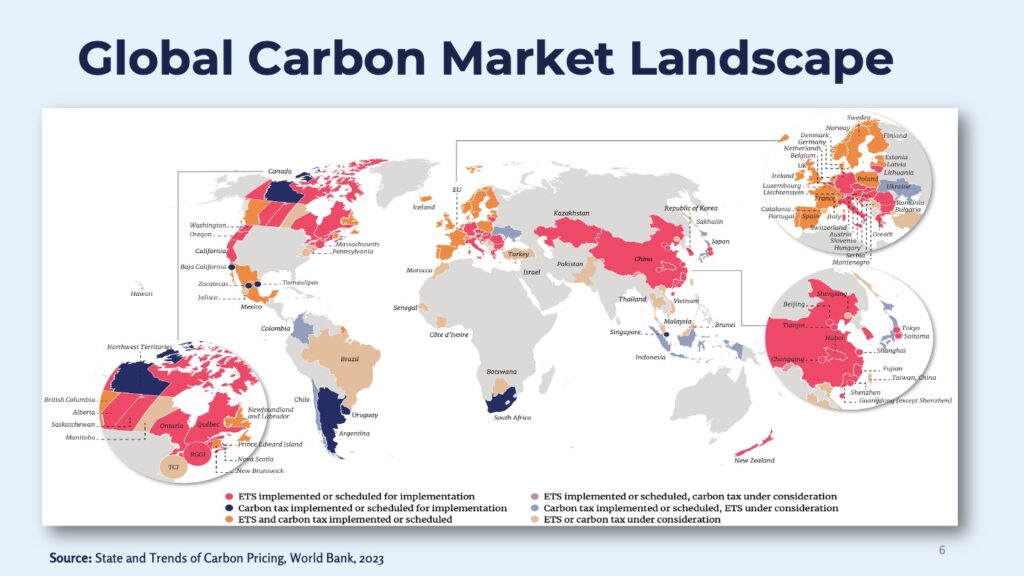
This shows the full view of the global carbon market landscape. As you see, there’s quite a presence in most of the regions in Asia, in Latin America, in North America, and Europe. You also see Kazakhstan from Central Asia, for instance. So far carbon pricing is not that developed in Africa and there may be obvious reasons for that.
Taxonomy of Climate Policy Instruments
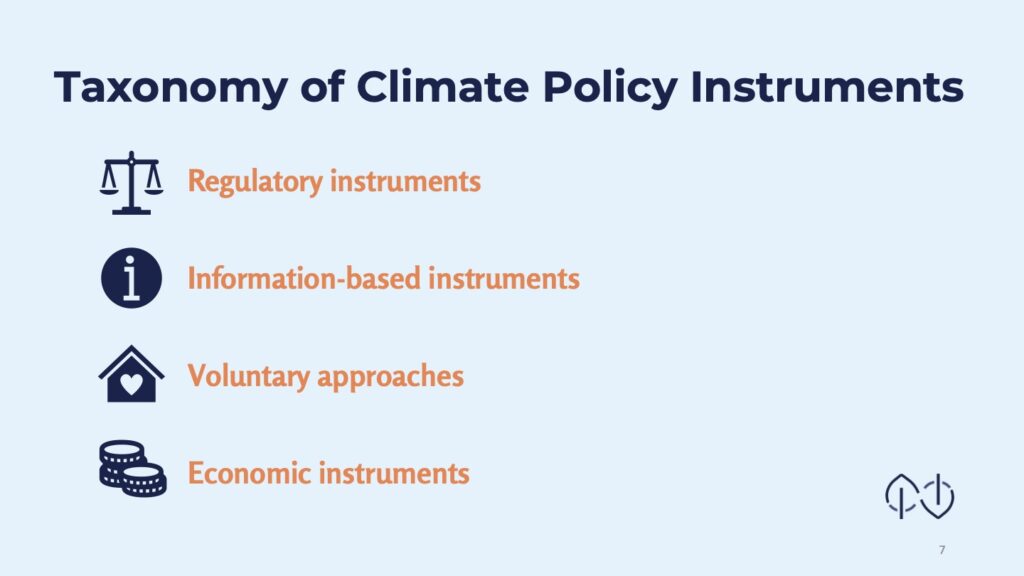
So we just mentioned briefly how, how it all started. Carbon pricing is an economic instrument for policy.
Traditionally in many countries worked with regulatory instruments. So a regulatory instrument is, for instance, saying that you cannot use this technology. You only can use this technology. You can’t emit more than this or you’re not allowed to pollute with these substances et cetera.
Then you have information based systems, instruments, and that can be in the form of information or communication campaigns to, to the public. It can also include disclosure of information, requiring disclosure of information.
Voluntary approaches can mean, for instance, that a group of companies make a deal with, with the government, a voluntary agreement to do something to reduce emissions or something. But it’s not under compliance. It’s something that they do voluntarily.
Then finally, we have economic instruments. We’ll come back to what that is in a moment.
Economic Instruments
So in the climate change area, economic instruments work by putting a price on carbon, and that means iternalizing the external costs of pollution. This creates an incentive for companies, for economic actors to reduce the emissions.
We call thee economic instruments because it’s provides flexibility for actors to choose how and where, and sometimes when to reduce their emissions. The idea is that by allowing this flexibility, the reduction should come at the cheapest overall cost. That’s the key thing for the key objective of economic instruments or carbon pricing – to do this as cost efficiently as possible.
Economic Instruments compared
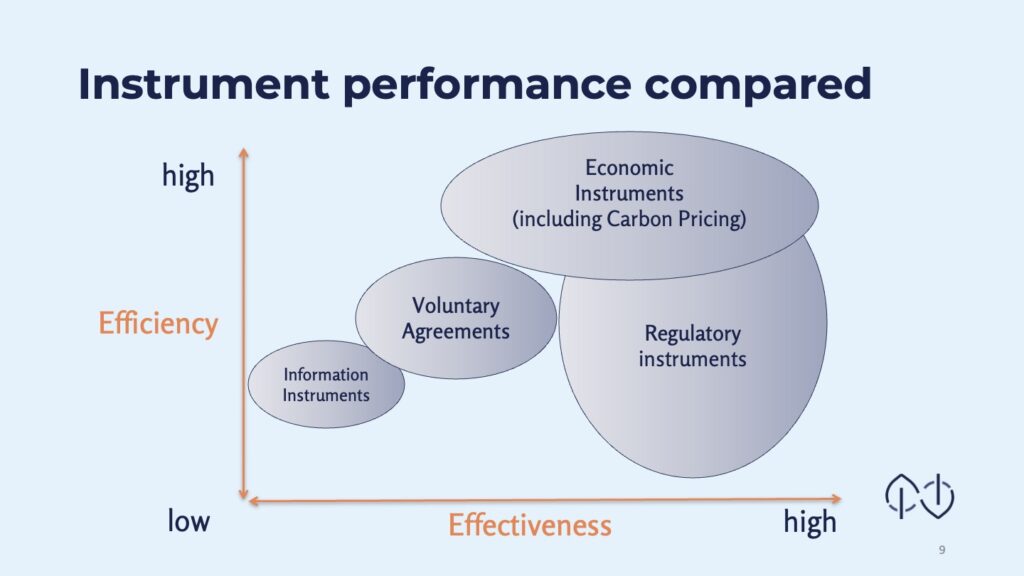
When we’re looking at efficiency and effectiveness of carbon pricing we can see that it’s high in efficiency. What does that mean? Well, it means that you will get a lot of bang for the buck. It means that carbon pricing is efficient in reducing emissions at low cost.
In this graph, you can see that information instruments are not that effective and are not that efficient. Same for voluntary agreements.
Regulatory instruments can also be very efficient, but can also come with a higher cost. At the same time, the effectiveness can be very high. So by regulation, of course, you can get exactly what you want. The problem can be that it might cost a little bit more.
Towards a Climate Policy Mix
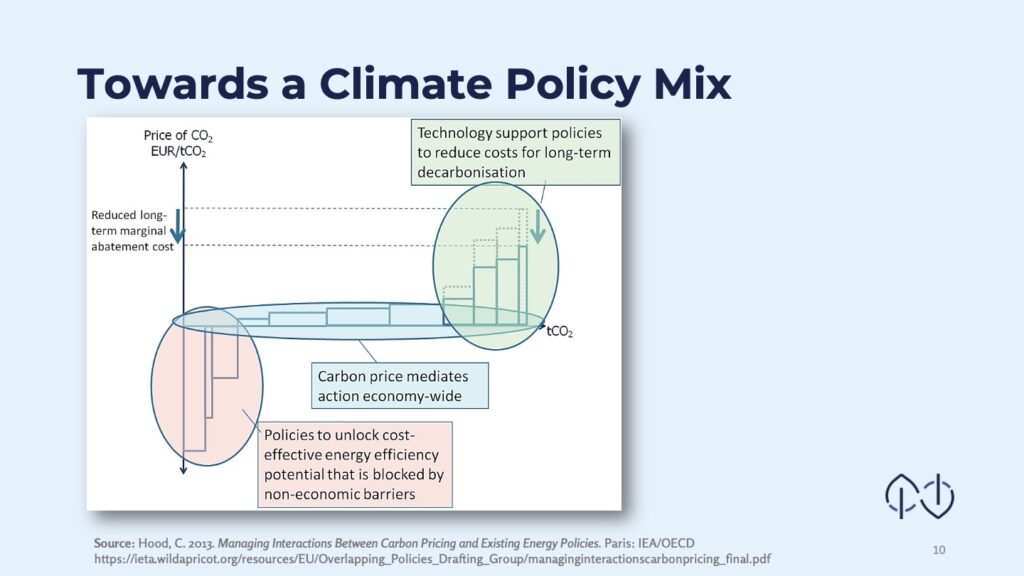
When we are looking at carbon pricing and where, and how it should be used, we are often looking at the abatement cost of emission reduction. So how much does it cost to reduce emissions? This graph shows that carbon pricing is useful at a level where it is not enormously expensive to reduce emissions. And where it is also now not a negative cost. Some emission reductions can be made simply by informing, and removing some barriers. Those barriers can typically be non-economic.
At the other end of the spectrum you have technologies for emission reductions that are expensive, that are at high cost. This is something probably that the carbon price cannot drive. This could be, for instance, carbon capturing and storage. Sucking carbon dioxide out of the air, those kind of technologies.
So for carbon pricing to work as at its best, it should be used for those sectors, for those type of emissions where there is a reasonably high cost or, or range of from low-cost to a high-cost of abatement.
Defining carbon pricing
So then exactly what is carbon pricing? Well, a direct price on carbon dioxide is one way to do carbon pricing.
But you can also do indirect or implicit carbon prices. And here there are many examples of this, for instance, putting a tax on fuel use. Here you have a carbon content of that fuel use, but you don’t price the emissions as such. What you do is you price the amount of the litres or gallons of the fuel used
The key principle as mentioned before, is making pollution or polluting more expensive. Economic actors have to account for the cost of their emissions when they’re making commercial decisions.
So on the market, businesses will treat these costs like any other costs and aim to reduce them to increase profit margins or to gain market market share.
How to explicitly price carbon?
So we can have a direct carbon price and we can have an indirect price. To directly price carbon, one way is to use carbon taxes. So that puts a price on greenhouse gas emissions, again, as we said, forcing the economic actors to internalize the cost of pollution.
The other way is to have a cap and trade instrument. And here we put a cap on a sector or several sectors that limits what these economic actors can pollute. This means that the companies can use allowances that are commoditized and traded in the market. We’ll come back to that a bit more in a second.
Carbon Tax vs. Cap-and-Trade
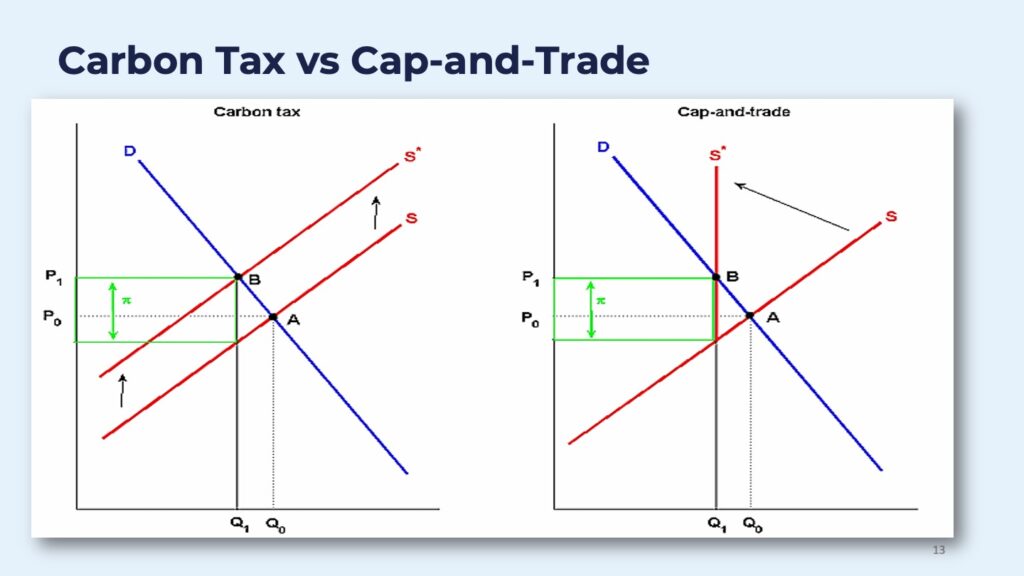
The graph above shows what happens using a demand and supply curve. As you see on the left, we have a carbon tax, and this means that the price is regulated, so the price goes up. The intention of that is that the demand for those products should go down. So this is the concrete impact. It’s simplified in the way that companies may want to pay this tax regardless and don’t increase their prices. Or consumers may want to pay a higher price.
We don’t have, or we don’t know the direct effect on the actual supply. That means that through a carbon tax, we will always know the price of carbon, but we won’t know the impact. We don’t know how many emission reductions will be reduced in the end.
On the right side we have Cap-and-trade. Here we set a cap for the emissions from one product or for several sectors. We can imagine that this is for one product that comes with some emissions. It simply says that you cannot sell more products with these emissions. There is a stop here.
And what this means is that we will know the impact in terms of emission reductions, but we don’t know the price. The price here is set by the market.
What is a Carbon Tax?
This is just repeating what we said, but a carbon tax is a tax that explicitly states the price on greenhouse gas emissions, or that uses a metric directly based on a carbon tax. So that creates a price per ton of CO2.
A carbon tax is a tax that explicitly states a price on greenhouse gas emissions or that uses a metric directly based on carbon (that is, price per tCO2e).
World Bank, Carbon Tax Guide: A Handbook for Policy Makers
Cap & Trade
What are Cap-and-trade Instruments?
Cap-and-trade is what we sometimes refer to as emissions trading. This involves commoditization of carbon dioxide as credits or allowances, which then can be traded in the market.
Two different approaches here. One is immediate emission trading systems and one is of offset crediting. In both cases, the idea is that a company, or a country or whatever actor that has lower costs than the market price for reducing for making the abatement are incentivized to sell to someone that has higher abatement costs.
So the whole market here is based on the idea that the cost for reducing emissions are different among different actors. And offset crediting can also be used in conjunction with emissions trading and with carbon taxes. We’ll come back a little bit more on exactly what, what this cap is about.
The cap defines the overall and primary goal of an emissions trading system.
Carbon markets are based on the concept of cap-and-trade. And a cap is almost always there. If there’s a company that sets a voluntary net zero target, it puts a cap on itself and trades. An NDC can include a cap for a number of emission reductions that the country wants to purchase.
An emissions trading system typically contains a legal limit. So the cap is often set by legislation. That regulates the quantity of greenhouse gas emissions that can be emitted within the system during a defined time period. This creates a scarcity of the permits or allowances for emitting and thereby creating a market price.
For this to work, the scarcity has to be real or maybe increasing over time so that there’s a sufficiently high and stable market price to incentivize continuous and consistent reduction of emissions. The cap is typically set for a compliance period. This can be for one year, or it can be for several years. It’s not unusual to have a trajectory of caps over the trading period, as shown in the example below.
The idea of an emissions trading scheme is that on the one hand the price for emitting.. let’s look at the short term, let’s say one year – there is an incentive to reduce emissions, otherwise they have to buy more allowances and that will be costly.
But the idea is also to have a long-term signal that emissions of carbon dioxide is gonna cost, and it’s gonna be more costly over time. So we should give both a short-term incentive and a long-term incentive.
Example of caps and long-term trajectory
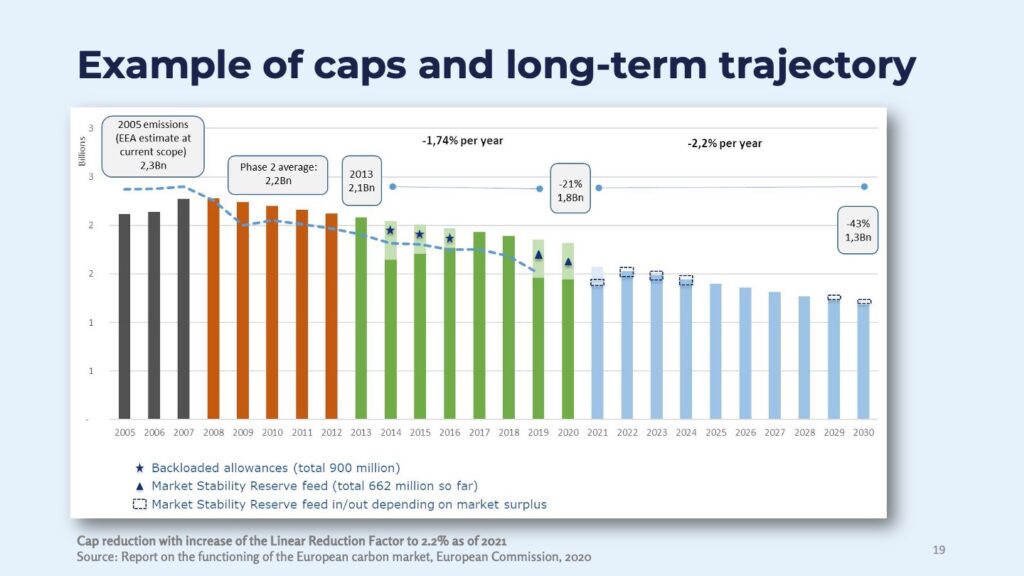
The above is an example of how you reduce the cap over time. This example is from the EU ETS and it shows how initially it’s a slow reduction of the cap, but it increases over time and that this trajectory should contribute to the European Union, achieving its net zero target.
You can see here for period up to 2020, it’s a linear reduction of a percentage. Then after 2021, this linear reduction targeting percentage increases. So that’s an example of how you ensure the price to be high or consistent over some time.
Absolute vs Intensity Targets
There are different ways of setting these targets. You can have an absolute emissions target and you can derive this in several ways. We’ll come back to that. But you can also have a relative emission reduction target, and you might ask, how does that work then?
Then it’s not really a cap. It becomes more complicated. This is the case, for instance, for the emissions trading scheme in China. It’s not a set cap of emissions per year or by 2030. It is an intensity target, so companies should not emit more than a benchmark, a certain level that is adjusted against the output.
And so, let’s say the final outcome of emission reductions will, in this case, as for the carbon tax, also not be known in advance. This will depend on other things, and you have to do a post assessment of how the emissions developed. The cap is in this way, you can say it’s post adjusted.
So this is possible, and it’s more complicated. And this is why some people say that the Chinese ETS is not really a cap-and-trade, it’s not really an emissions trading scheme. It is something similar, but not exactly a cap and trade scheme.
Stringency of the cap
The stringency of the cap is of course very important, and how this is set (it is set in different ways in different countries, in different systems) will impact the scarcity of allowances and will also then impact the price.
As we said, a high allowance price, given that nothing else is changed, incentivises the economic actors to invest in technological innovation, research and development. They do this provided that the price signal is credible and it’s consistent, and they expect it to be there over time.
So if you have an intensity based cap, the stringency of this depends on other things and you would need to address other parameters such as GDP. So the outcome of the ETS will depend on not only emissions, but also depend on other factors.
Share of capped and un-capped sectors
When countries look at this, they also have to decide on what sectors to include in the emissions trading scheme. So often you can have an economy-wide emission reduction target, and you can include all sectors to contribute to that target.
But as we showed before, in some sectors emission trading is maybe not feasible, and perhaps other instruments are more feasible in other sectors.
In this case, the government may need to look at the marginal abatement costs of the different activities in each sector, and then decide what sectors to include and what sectors not to include.
What typically happens is that you have emissions trading in the energy sector, for example Indonesia is starting with that. China is starting with that, and you also add industrial sectors. Then it becomes more complicated to include transport and agriculture. But that’s the way for instance, the EU ETS is going.
When you have sectors that are capped and also you have sectors that are not capped, you can allow offset credits from the uncapped sectors as an alternative for compliance for the economic actors that are under compliance in the capped sector (Domestic offsets). This is quite usual and allowed in many cases. It’s allowed in, Korea and it’s allowed in China up to 5%. It’s not currently the case in the EU ETS, but it’s been allowed be before. So it is a common strategy.
Consistent stringency of caps over time
We also mentioned this briefly that to have a stringency over time, there are ways to reduce the cap over time. You can do this by reducing the number of allowances.
Very briefly and simply, you can do this by having a liner reduction, you can have an exponential reduction, or you can do it stepwise.
The purposes of this is to ensure that the price is high over a longer period of time. It also gives the signal to businesses, to the private sector, that over time the number of allowances will decrease and the shortage, the scarcity of allowances will continue to be low.
Top-down approaches to cap-setting
Briefly, there are two ways of setting a cap. The first one is top down. For instance, you may have a country that has a target of reducing by X percent, by year X compared to baseline year Z. This is a typical way of setting climate targets in a country.
So you can start with this, and look at the ETS, and decide on how much the capped sectors should contribute to this target. Should it be a large part of the emission reductions? There are different ways of looking at looking at that.
Bottom-up approaches to cap-setting
Another alternative is to create the cap bottom-up. Here can you start with start with historical emissions trends or you can start with the mitigation potential and the costs for reducing emissions. Then you start to build a cap of what is possible or what is feasible.
There are pros and cons of both these approaches. I think in reality what is done is something in between. I’m not going into more detail on this but just remember two approaches to setting this this cap.
Top-down and Bottom-up
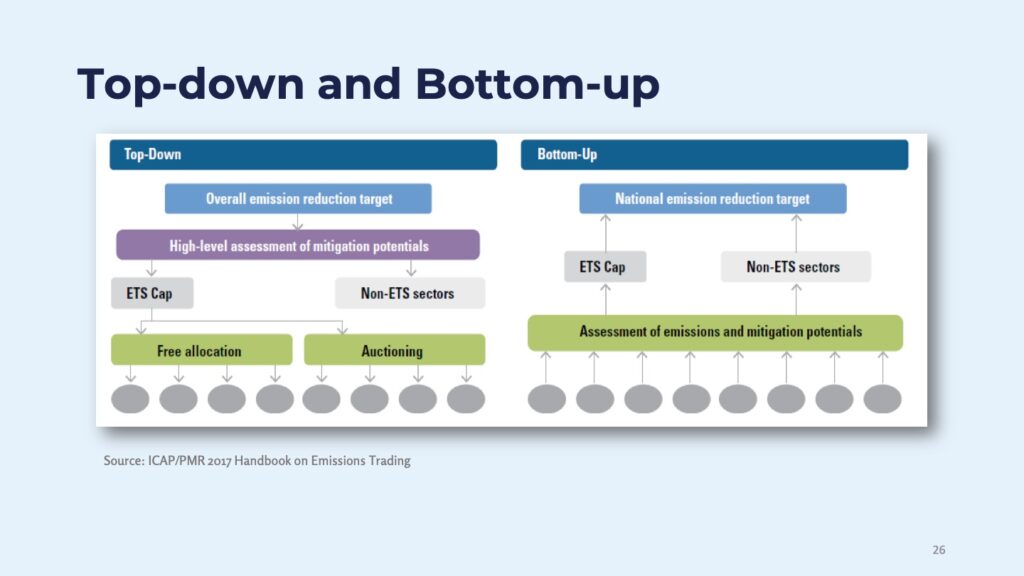
Above is an overview of this. You see, to the left, that you start with your overall emission reduction target. You make a high level assessment of the mitigation potential, decide what’s going into the ETS and what is not going into the ETS.
On the other side, if you have a bottom-up scheme, you start to look at what is possible, what it costs to reduce. From that, you look at what sectors can be included and what not. Then you look at, okay, this can contribute this much to the national target, let’s do it. So very simple graphics. In reality, you do a little bit of both of these things at the same time.
Additional issues that affect the cap
Finally a few words on what can affect the cap and thus the price level. Things that you can regulate or things that are in the power of government that affects the cap or following things:
Access to domestic and/or international offsets
Access to other emissions trading schemes
You can also link with another emissions trading scheme. This was done between California and Quebec. I actually don’t know the status of this…if they’re still linked or not.
The EU ETS is linked with Switzerland. And this affects, of course, the overall cap because you put together two caps and then how it affects the price, et cetera, depends a little bit on the volumes and the abatement costs in the country which you’re linking with.
Right to bank and borrow
There are other ways to create flexibility. You can allow entities, companies to bank emission allowances. So they, have it in this period or this year, but they’re allowed to save, to use for the next year. And it’s also possible in some cases, that you can borrow from the next period if you have a free allocation or allowances you can borrow from, a future period.
GDP Growth and new entrants
Then you have things also that of course, impact the cap, like how the economy grows, because that may impact the growth of emissions. As an example from the EU ETS, when there was an economic crisis, of course the emissions went down and that creates a surplus of allowances and a lower price.
You also need to think about new entrants, new economic actors, entities, companies that are going into the system that weren’t there before. That is especially important in countries where you have fast growing economic sectors.
Integration with other policy instruments
And of course, finally (which has nothing to do with the flexibility or the linking, et cetera) is how other policy instruments impact the emissions trading cap. Here there have been discussions in Europe for instance, where renewable energy targets have pushed the price down in the EU ETS because you have a renewable energy policy that supports the introduction of renewable energy. The demand for electricity from fossil fuel goes down therefore the need for allowances goes down. So that affects the cap. And while it’s very good that emissions go down, these other policy instruments interfere with the idea of the ETS. So the prices go down and the prices within the ETS does not have the same incentive level as before.
Lessons learned
So that was a background the theory and basics a little bit, a very brief international outlook, an overview about the cap and the cap setting, which is sort of the key to emissions trading generally.
Let me just spend a couple more minutes on the lessons learned and other issues relating to carbon pricing.
Other benefits of carbon pricing
Revenue generation
Introducing emissions trading or carbon tax can create a new source of income for governments. This income can be used for tax reforms, for supporting innovation in low carbon technologies. You can, if you have a tax or an ETS that leads to higher electricity prices, choose to support the vulnerable households that are most affected by that higher electricity price. So this is a new source of income that the governments can play with.
Environmental co-benefits beyond climate
When reducing carbon dioxide emissions, you typically also in many cases reduce other forms of pollution. So you get better air quality, there will be health benefits, et cetera.
Facilitate innovation and a shift toward low-carbon investments
In the long term carbon pricing supposedly, hopefully, spurs businesses to invest in low carbon alternatives. So the whole pattern of investment should be changed.
Other lessons learned
Must be properly designed and implemented
Now on the more negative side, carbon pricing will only deliver cost efficient reductions if they’re properly designed and implemented. In many cases we’ve seen that ETS’s in the beginning create perverse incentives. That can result in windfall profits for companies that receive free allocation. You can have the negative policy interactions effect that I mentioned, for instance, the EU renewable energy policy.
And we saw also in the EU ETS in the beginning attempts or well, not attempts, they were quite successful in VAT fraud and other things that could happen because it’s a new market. It was a cross-border market and you had, fraudulent behavior of some of the market participants.
But that said, the experience now shows that there’s a lot of successful examples of carbon pricing being implemented.